traceroute vs mtr
When a packet travels across the Internet, it travels through multiple routers. The traceroute and mtr tools can be used to identify the routers a packet passes through between you and a given destination IP address. traceroute is a one-shot sort of tool whereas mtr runs and aggregates the results of a number of traceroutes. If you simply want to find the routers your packet passes through, traceroute is fine. If you want to diagnose a problem such as packet loss, mtr is the tool to use.
In this blog, we’ll talk in the context of the output of mtr given it is more versatile.
Types of trace
traceroute and mtr both support different types of tracing. The two main types are UDP and ICMP. Both trace types send a series of packets, with incrementing time-to-live (TTL) fields. The idea is that if a packet is sent with a TTL of 1, it will be rejected (with an ICMP TTL Exceeded message) at the first router in the network. We then send a packet with a TTL of 2 and it is rejected at the second router in the network… and so on. We use the source IP address and timings of the TTL Exceeded messages to build our path list.
Some routers will not send TTL exceeded messages for UDP, ICMP or both. In this author’s experience, ICMP is a more reliable type of trace so should be your first port of call. For traceroute you should call it as traceroute -I for ICMP mode. ICMP is usually the default for mtr so no parameters are needed.
mtr Fields
Output from the mtr command looks something like this:
                             My traceroute  [v0.92]
home (62.3.100.24)                                     2022-03-17T18:20:20+0000
Keys:  Help   Display mode   Restart statistics   Order of fields   quit
                                       Packets               Pings
 Host                                Loss%   Snt   Last   Avg  Best  Wrst StDev
 1. 62-3-100-30.dsl.in-addr.zen.co.u  0.0%     5    0.6   0.6   0.5   0.6   0.0
 2. ???
 3. lag-8.p2.thn-lon.zen.net.uk       0.0%     5   12.3  12.3  12.2  12.5   0.1
 4. lag-2.br1.thn-lon.zen.net.uk      0.0%     5   12.3  12.3  12.0  12.5   0.2
 5. 72.14.223.28                      0.0%     5   12.9  12.8  12.4  12.9   0.2
 6. 209.85.249.149                    0.0%     5   13.4  13.7  13.3  14.2   0.4
 7. 142.251.54.27                     0.0%     5   12.0  11.8  11.4  12.0   0.2
 8. dns.google                        0.0%     4   12.1  11.8  11.6  12.1   0.2
You will see:
- The hostname or IP address of that particular hop on the network (run
mtr -nif you don’t want it to resolve IPs to hostname) - The percentage of packets lost by that hop
- Number of packets sent to that hop
- The round trip time (i.e. how long it took to get a response) for the hop
- The average, best, worst and standard deviation round trip times, since you started running the mtr
mtr hops
In the above mtr, you will see 8 hops. The second hop shows as ???. That is because it did not send a TTL exceeded message in response to our probe. This really isn’t uncommon and is nothing to worry about, if the missing hops are in the middle of the trace. The trace got beyond that hop, so it’s not a problem. If all of the ??? are at the end then this might be indicative of a problem (i.e. 100% packet loss from that point). OR it might just mean that none of the last few hops send TTL exceeded messages. It’s hard to tell.
mtr hop DNS names
The DNS names shown by mtr can be very revealing. Many large providers put information about their routers in the DNS name. In the above example, you will see lag-2.br1.thn-lon.zen.net.uk. This is, most probably, link aggregation interface 2 on a router named br1 in Telehouse North datacentre in London UK. As such, we can start to get an understanding of the physical path around the world a packet takes.
Look at the below mtr:
                             My traceroute  [v0.92]
home (62.3.100.24)                                     2022-03-17T18:32:05+0000
Keys:  Help   Display mode   Restart statistics   Order of fields   quit
                                       Packets               Pings
 Host                                Loss%   Snt   Last   Avg  Best  Wrst StDev
 1. 62-3-100-30.dsl.in-addr.zen.co.u  0.0%    18    0.5   0.5   0.4   0.9   0.1
 2. ???
 3. lag-8.p2.thn-lon.zen.net.uk       0.0%    18   12.1  12.3  11.9  12.7   0.2
 4. lag-2.br1.thn-lon.zen.net.uk      0.0%    18   12.1  12.6  11.9  15.5   1.0
 5. ge-3-3-0.mpr1.lhr3.uk.above.net   0.0%    18   11.9  12.3  11.7  13.7   0.6
 6. ae10.cs3.lhr11.uk.zip.zayo.com   88.2%    18   83.5  83.7  83.5  83.9   0.3
 7. ae5.cs1.lga5.us.eth.zayo.com      0.0%    18   82.9  83.8  82.7  90.4   1.8
 8. ae8.mpr3.bos2.us.zip.zayo.com     0.0%    18   87.3  83.6  82.6  87.3   1.5
 9. ???
10. ???
11. http-lb-02.us.cloudcall.com       0.0%    17   88.8  90.0  88.3  92.1   1.2
We can see that the packet goes via:
- Zen in London Telehouse North
- Zayo/AboveNet in London (lots of providers like to use airport codes for their router location. LHR is London Heathrow)
- Zayo in New York
- Zayo in Boston
This also implies that the destination is, probably, a Zayo customer but we can’t tell for sure as hops 9 and 10 are blank.
Packet loss and Round Trip Times
You will see in the above mtr example that hop 8 (ae10.cs3.lhr11.uk.zip.zayo.com) has 88.2% packet loss. This is bad, right? No. Packet loss and increased RTT on a single hop is expected, if that hop limits the rate at which it sends TTL Exceeded ICMP messages.
The key thing that many people fail to understand about an mtr or traceroute is: Unless packet loss or increased RTT is seen on every hop between a given hop and the end of the trace, it is not a problem.
Take this trace, for example:
HOST: localhost                      Loss%   Snt   Last  Avg  Best  Wrst   StDev
   1. 63.247.74.43                   0.0%    10    0.3   0.6   0.3   1.2   0.3
   2. 63.247.64.157                  0.0%    10    0.4   1.0   0.4   6.1   1.8
   3. 209.51.130.213                60.0%    10    0.8   2.7   0.8  19.0   5.7
   4. aix.pr1.atl.google.com        60.0%    10    6.7   6.8   6.7   6.9   0.1
   5. 72.14.233.56                  50.0%    10    7.2   8.3   7.1  16.4   2.9
   6. 209.85.254.247                40.0%    10   39.1  39.4  39.1  39.7   0.2
   7. 64.233.174.46                 40.0%    10   39.6  40.4  39.4  46.9   2.3
   8. gw-in-f147.1e100.net          40.0%    10   39.6  40.5  39.5  46.7   2.2
We can see that hop 3 has 60% packet loss and that loss carries all the way to the end of the trace, which has 40% packet loss. This means that hop 3 is possibly (see below section on forward vs return path) introducing packet loss and the total loss between you and your destination is 40%. The other 20% can be ignored.
What we can learn from Round Trip Time (RTT)
RTT of each hop is a useful metric to us because it tells us how long a packet took to get to that hop, as compared to the previous hop. Take this mtr:
                                      My traceroute  [v0.92]
home (62.3.100.24)                                                       2022-03-17T18:57:17+0000
Keys:  Help   Display mode   Restart statistics   Order of fields   quit
                                                         Packets               Pings
 Host                                                  Loss%   Snt   Last   Avg  Best  Wrst StDev
 1. 62-3-100-30.dsl.in-addr.zen.co.uk                   0.0%     7    0.5   0.6   0.5   0.8   0.1
 2. ???
 3. lag-8.p1.thn-lon.zen.net.uk                         0.0%     7   12.2  15.8  12.2  25.2   6.2
 4. lag-1.br1.thn-lon.zen.net.uk                        0.0%     7   12.3  12.9  12.1  16.4   1.6
 5. ldn-b3-link.ip.twelve99.net                         0.0%     6   12.1  12.7  12.0  15.6   1.4
 6. ldn-bb4-link.ip.twelve99.net                        0.0%     6   12.2  12.3  11.9  12.9   0.4
 7. nyk-bb1-link.ip.twelve99.net                        0.0%     6   84.5  84.5  84.3  84.7   0.2
 8. nyk-b2-link.ip.twelve99.net                         0.0%     6   81.7  81.7  81.6  81.9   0.1
 9. choopa-svc071182-lag000971.ip.twelve99-cust.net     0.0%     6   88.5  86.9  81.3  95.9   6.5
10. ???
We can see that the RTT increases sharply between hops 6 and 7. We can see, by the DNS names, that hop 6 is in London UK whereas hop 7 is in New York USA. As such, we expect a significant increase at this point which we would expect to carry through to the end of the trace. Remember: Unless packet loss or increased RTT is seen on every hop between a given hop and the end of the trace, it is not a problem.
This is useful because if it wasn’t obvious that hop 6 was UK and hop 7 was USA then we can quite clearly see where the packet crossed the Atlantic.
If we know that both source and destination are in the UK and we see big increases in RTT between a given hop and the end of the trace, then we know something is wrong. Maybe it’s going a really long way round (e.g. to the US and back) or maybe a particular hop is possibly introducing latency.
A note about MPLS
You might look at a trace between the UK and Australia and see the packet leave the UK on hop 5 then arrive in Australia on hop 6. In reality, it’s almost certainly not going directly between the two points. There will be an MPLS network, in the middle, which will obscure the path to some extent. This doesn’t really matter as if you are sure that a Zayo hop is introducing problems, it doesn’t matter whether it’s in London or Las Vegas, it’s still Zayo’s problem.
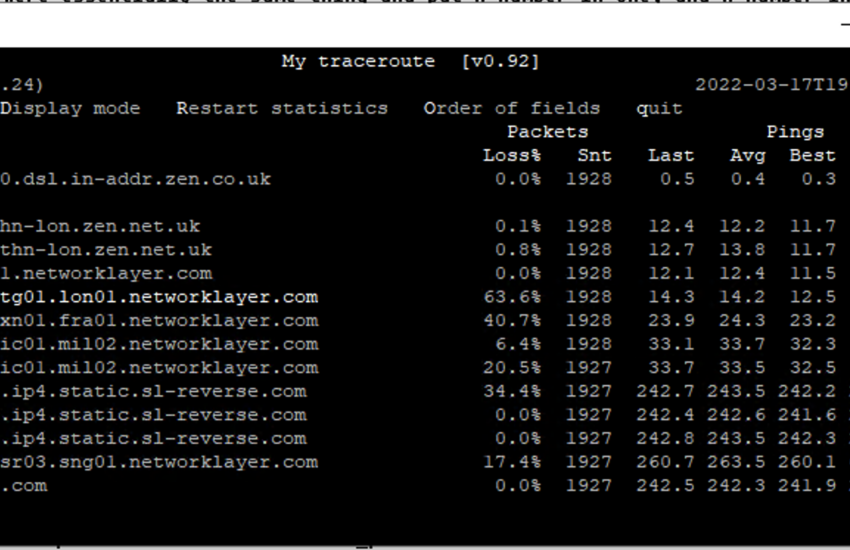
Fun tip: you can press e when an mtr is running to see MPLS labels from some of the hops:
                                      My traceroute  [v0.92]
home (62.3.100.24)                                                       2022-03-17T19:08:05+0000
Keys:  Help   Display mode   Restart statistics   Order of fields   quit
                                                         Packets               Pings
 Host                                                  Loss%   Snt   Last   Avg  Best  Wrst StDev
 1. 62-3-100-30.dsl.in-addr.zen.co.uk                   0.0%    74    0.4   0.5   0.4   0.8   0.1
 2. ???
 3. lag-8.p2.thn-lon.zen.net.uk                         0.0%    74   12.6  13.7  12.0  32.0   3.4
    [MPLS: Lbl 24012 Exp 0 S 1 TTL 1]
 4. lag-2.br1.thn-lon.zen.net.uk                        0.0%    74   17.7  14.2  11.8  35.4   4.4
 5. bbr02.lon01.networklayer.com                        0.0%    74   12.1  13.5  11.7  30.0   3.2
 6. ae5.cbs01.tg01.lon01.networklayer.com              64.4%    74   12.8  15.1  12.6  21.3   2.9
    [MPLS: Lbl 205039 Exp 0 S 1 TTL 1]
 7. ae0.cbs01.xn01.fra01.networklayer.com              41.1%    74   26.7  25.3  23.4  43.4   3.4
    [MPLS: Lbl 126402 Exp 0 S 1 TTL 1]
 8. ae0.cbs02.ic01.mil02.networklayer.com               1.4%    74   32.5  35.7  32.5  61.2   5.4
    [MPLS: Lbl 809963 Exp 0 S 1 TTL 1]
 9. ae7.cbs01.ic01.mil02.networklayer.com              21.9%    73   34.9  35.4  32.6  65.7   5.4
    [MPLS: Lbl 288384 Exp 0 S 1 TTL 1]
10. 61.13.2da9.ip4.static.sl-reverse.com               30.1%    73  242.4 244.3 242.3 254.7   2.6
    [MPLS: Lbl 423005 Exp 0 S 1 TTL 1]
11. af.13.2da9.ip4.static.sl-reverse.com                0.0%    73  242.3 244.1 241.8 257.6   3.7
    [MPLS: Lbl 499542 Exp 0 S 1 TTL 1]
12. cb.12.6132.ip4.static.sl-reverse.com                0.0%    73  242.8 244.1 242.5 254.5   2.5
13. po2.fcr01.sr03.sng01.networklayer.com              30.1%    73  261.2 277.6 260.8 547.7  52.5
14. sip3.nexmo.com                                      0.0%    73  242.4 243.4 242.1 258.0   2.5
Understanding Forward vs Return Path
The path a packet takes between A and B is very often not the same as the path it takes between B and A. This means that if you were to ping a particular IP address then your ping (echo request) is likely to take a different path than the response (echo reply).
This means that when you mtr or traceroute and see packet loss starting at a given hop, it is not necessarily that hop that is to blame. Imagine a trace which looks like this: You (Zen ISP) -> Zayo (A large transit ISP) -> Amazon Web Services (AWS). In your trace, you see 40% packet loss somewhere near the edge of the AWS network. You don’t see any loss on Zen or Zayo… so the problem must be AWS, right?
Nope. AWS might have a different path to reach you from their network. Maybe it’s AWS -> NTT (Another large transit ISP) -> You (Zen ISP). Maybe your ping packet got all the way to AWS and it was, in fact, the response packets that are getting lost somewhere inside NTT.
The only way to know for sure is to take a traceroute from both ends (i.e. trace from you to the destination and again from the destination to your IP). Clearly this isn’t always possible, if the destination is somebody else’s website. In reality, in the above case, the problem is still AWS’s. They have a contract with NTT, NTT is broken, AWS needs to speak to NTT. In some other cases where settlement free (i.e. free of charge) peering is at play, such as on Internet Exchanges, this can be politically tricky as nobody has a contract or support agreement to fall back on when things don’t work.
Good article. Can you follow it up with the differences between using icmp echo and udp or tcp syn for tracing?
The note about MPLS hiding hops, whilst true if TTL isn’t propagated to the label header only highlights one aspect of traceroute when passing over an MPLS backbone.
If TTL is propagated and when passing over a a BGP free core (or if internet is in a VRF for example and not all trasnit boxes carry that VRF etc) then the routers in the path have no idea where to send the ICMP TTL expired as they are just label switching and don’t carry a route to the origin of the traceroute probe in their global table. The solution (for all its faults) is to tunnel the ICMP TTL expired across the MPLS network all the way to the egress PE which, generally speaking is going to have a route back to the origin of the traceroute probe.
What that then means for a how a traceroute looks is all hops after the egress PE on the MPLS network are going to have pretty much an identical round trip time. So you may have a packet enter a network close to you and the next hop might after that might be in the same country as you but the RTT could be 200ms as the egress PE is at the other side of the world.
So you could ingress in the UK and first hop looks close. Destination is Asia but there are 10 hops in Europe plus a couple more in Asia. All hops after ingress will have same RTT of 200ms and it confuses the hell out of people who don’t understand MPLS networks and they complain about hops in Europe being 200ms away from them in Europe etc.
That’s a great insight, thank you for adding it
Reminds me of a post I wrote a decade ago on a certain developer Q/A board, but yours is much more detailed. I shall henceforth use yours instead of mine when pointing colleagues at tips for debugging network issues :-).
I have two notes:
> OR it might just mean that none of the last few hops send TTL exceeded messages. It’s hard to tell.
This may be differentiable by running a parallel test with ping. In some cases, hosts won’t send TTL exceeded (or it gets filtered by a particularly nasty edge firewall), but will happily reply to normal ICMP echo requests.
The other note is that MTR may sometimes look successful, even though ping does not. This is particularly the case if you are tracing into some OpenStack-based clouds. One of the mechanisms by which OpenStack exposes virtual machines (VMs) to the internet is called Floating IP. It works by attaching that (public) IP address to the virtual router in front of the VM, and then performing destination network address translation (DNAT) to the private (internal) IP address of the VM.
That means that from the outside, both the VM and the router will happily reply to the *same* public IP address (because when the VM replies with its internal IP, the router will reverse the DNAT and you’ll see the reply from the public IP). This can be confusing with mtr, because mtr may not detect that the VM is actually not responding: To mtr, the trace looks complete when the router replies with TTL exceeded from the VM’s public IP address. Yet, ping may run into a blackhole, because the router does *not* reply to ICMP Echo request packets, it DNATs them to the VM.
[Ideally, the router would use its own public IP address for the TTL exceeded reply, but for some reason that doesn’t happen, which leads to this very confusing behaviour.]
I hope that made sense? It’s a bit icky to explain, because it’s icky (it involves NAT, after all).
I think the long-story-short of my ramblings is: It is advisable to always run ping in parallel to mtr, because they test different things and that may give you some valuable insight to where a problem truly is, especially in the full-loss cases.
Some great advice – thank you Jonas
For most of the year I’ve suffered dropped UDP packets at peak hours – it’s incredibly frustrating and impossible to game on (CS, Dota 2 etc). I went down the usual diagnosis route: collected traceroutes, no packet loss over Mozilla/Mullvad VPN, no iperf packet loss directly to a VPS in the same Amsterdam data centre (AM5) and no packet loss for ~30 minutes after resetting my router (obtaining a new WAN IP). Ultimately I was able to show through elimination that Zayo is massively oversubscribed and can’t handle the traffic: their shitty traffic shaping solution drops ~14% of UDP packets. I suspect Chrome’s move to HTTP3/QUIC has significantly contributed to this (real-time UDP traffic is now indistinguishable from browser traffic). After a brief-call-to-arms with my ISP, Hyperoptic, I managed to convice their NOC to get the Valve NOC to reject Zayo advertisements… a day later, new level3 routes and packet loss solved for good!